Taking inspiration from Vlad’s post I’ve been playing around with alternate means of viewing traffic/data generated by Android apps.
The technique that has given me most joy is memory analysis. Each application on android is run in the Dalvik VM and is allocated it’s own heap space. Android being android, free and open, numerous ways of dumping the contents of the application heap exist. There’s even a method for it in the android.os.Debug library: android.os.Debug.dumpHprofData(String filename). You can also cause a heap dump by issuing the kill command:
kill -10 <pid number>
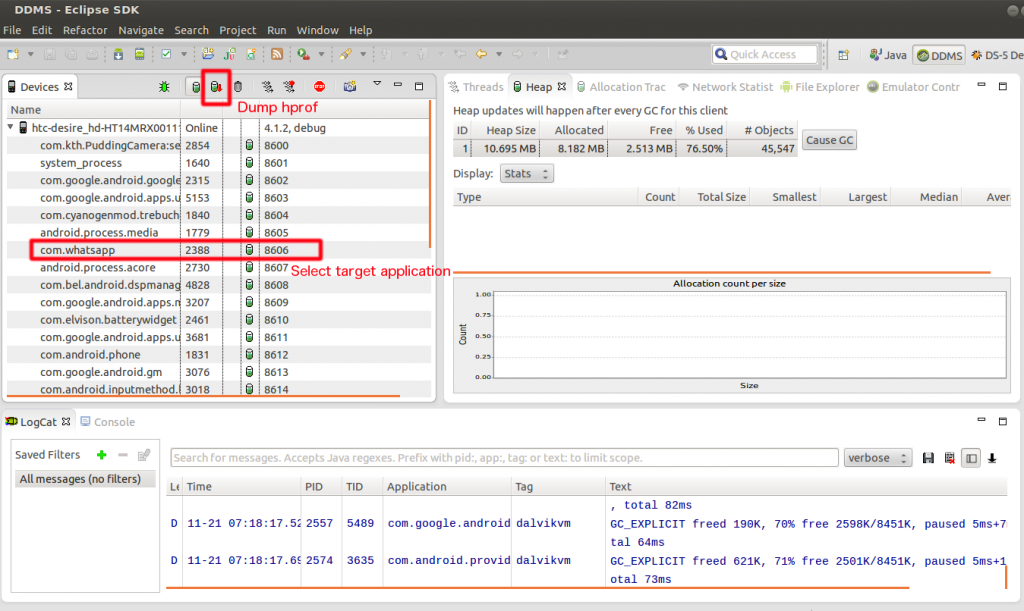
But there is an easier way, use the official Android debugging tools… Dalvik Debug Monitor Server (DDMS), — “provides port-forwarding services, screen capture on the device, thread and heap information on the device, logcat, process, and radio state information, incoming call and SMS spoofing, location data spoofing, and more.” Once DDMS is set up in Eclipse, it’s simply a matter of connecting to your emulator, picking the application you want to investigate and then to dump the heap (hprof).
1.) Open DDMS in Eclipse and attach your device/emulator
* Set your DDMS “HPROF action” option to “Open in Eclipse” – this ensures that the dump file gets converted to standard java hprof format and not the Android version of hprof. This allows you to open the hpof file in any java memory viewer.
* To convert a android hprof file to java hprof use the hprof converter found in the android-sdk/platform-tools directory: hprof-conv <infile> <outfile>
2.) Dump hprof data
Once DDMS has done it’s magic you’ll have a window pop up with the memory contents for your viewing pleasure. You’ll immediately see that the applications UI objects and other base classes are in the first part of the file. Scrolling through you will start seeing the values of variables stored in memory. To get to the interesting stuff we can use the command-line.
3.) strings and grep the .hprof file (easy stuff)
To demonstrate the usefulness of memory analysis lets look at two finance orientated apps.
The first application is a mobile wallet application that allows customers to easily pay for services without having to carry cash around. Typically one would do some static analysis of the application and then when it comes to dynamic analysis you would use a proxy such as Mallory or Burp to view the network traffic. In this case it wasn’t possible to do this as the application employed certificate pinning and any attempt to man in the middle the connection caused the application to exit with a “no network connection” error.
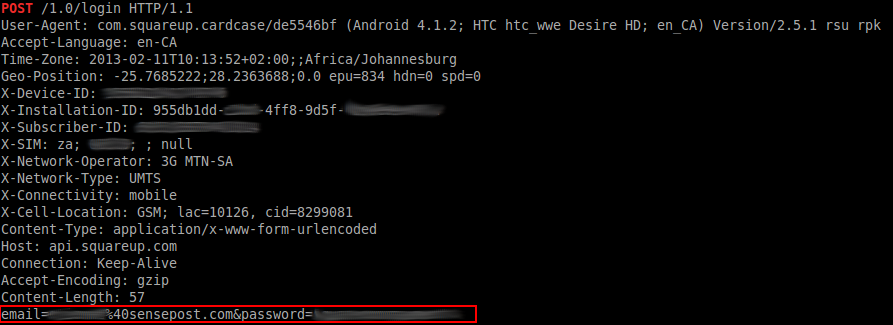
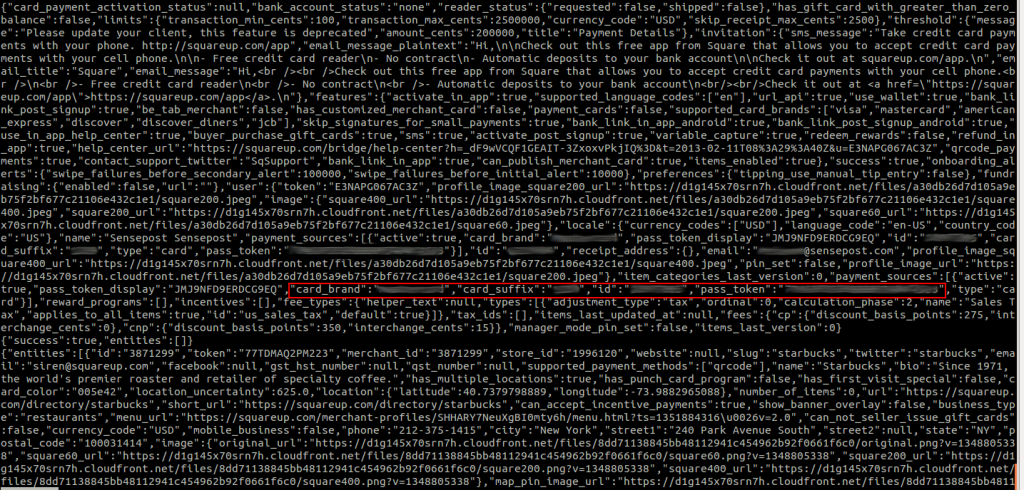
So what does memory analysis have to do with network traffic? As it turns out, a lot. Below is a sample of the data extracted from memory:
And there we have it, the user login captured along with the username and password in the clear. Through some creative strings and grep we can extract a lot of very detailed information. This includes credit card information, user tokens and products being purchased. Despite not being able to alter data in the network stream, it is still easy to view what data is being sent, all this without worrying about intercepting traffic or decrypting the HTTPS stream.
A second example application examined was a banking app. After spending some time using the app and then doing a dump of the hprof, we used strings and grep (and some known data) we could easily see what is being stored in memory.
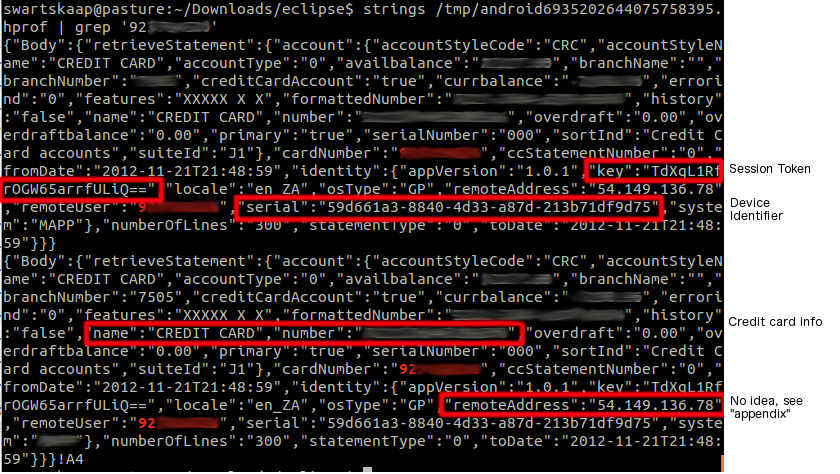
strings /tmp/android43208542802109.hprof | grep ’92xxxxxx’
Using part of the card number associated with the banking app, we can locate any references to it in memory. And we get a lot of information..
And there we go, a fully “decrypted” JSON response containing lots of interesting information. Grep’ing around yields other interesting values, though I haven’t managed to find the login PIN yet (a good thing I guess).
Next step? Find a way to cause a memory dump in the banking app using another app on the phone, extract the necessary values and steal the banking session, profit.
Memory analysis provides an interesting alternate means of finding data within applications, as well as allowing analysts to decipher how the application operates. The benefits are numerous as the application “does all the work” and there is no need to intercept traffic or figure out the decryption routines used.
Appendix:
The remoteAddress field in the response is very interesting as it maps back to a range owned by Merck (one of the largest pharmaceutical companies in the world http://en.wikipedia.org/wiki/Merck_%26_Co.) .. No idea what it’s doing in this particular app, but it appears in every session I’ve looked at.


